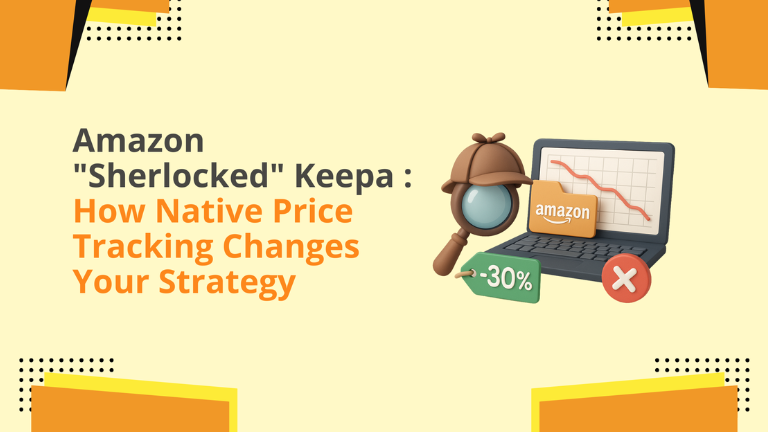
In the tech world, “Sherlocking” is when a platform (like Apple or Amazon) takes a feature from a popular third-party app and builds it directly into the operating system, rendering the app obsolete for the average user.
Amazon just Sherlocked price tracking.
For years, savvy shoppers and sellers used tools like Keepa or CamelCamelCamel to see price history. But now, Amazon is testing a Native Price History feature—a built-in chart on the product page (mobile and app) that shows the last 30 to 90 days of pricing.
This isn’t just a “cool feature.” It is a strategic enforcement mechanism designed to kill the “High-Low” pricing game.
The End of the “Fake Discount”
We all know the tactic: Raise the price from $25 to $35 in October so you can offer a “30% Off” Black Friday deal at $25.
- Before: Only Keepa users knew. Most shoppers saw “30% Off” and clicked.
- Now: Every shopper sees a graph that spikes up and drops down. It looks suspicious. It signals manipulation.
This tool gives customers (and Amazon’s Rufus AI) “X-Ray vision” into your pricing strategy. If your “deal” is actually just your regular price from two weeks ago, the graph exposes it instantly.
Rufus is the New Personal Shopper
This feature is heavily integrated with Rufus, Amazon’s AI assistant. Shoppers don’t even need to read the graph. They can just ask Rufus: “Is this a good time to buy?” Rufus analyzes the 90-day history. If your price is trending up, or if you just hiked it, Rufus will advise the customer to wait. You aren’t fighting a human’s impulse anymore; you’re fighting an AI’s analysis.
The New Pricing Playbook: Stability = Trust
To win in a transparent market, you must pivot your strategy.
- The 90-Day Rule: Your promotional calendar must be planned 90 days in advance. To show a legitimate discount without a suspicious graph spike, you need to establish a stable “Reference Price” for at least 30-60 days before the deal drops.
- Everyday Low Price (EDLP) Model: Volatility is now a liability. Brands that maintain a consistent, fair price will show a flat, stable line on the graph. This builds subconscious trust. Use coupons for small, temporary dips rather than changing the backend List Price, which warps the graph.
- Sell Value, Not Deal: Since you can’t rely on inflated “Was” prices to drive conversion, your listing content must work harder. Your images, video, and A+ content must justify your full price. If the customer sees the graph and realizes $30 is the normal price, your product better look like it’s worth $30.
KPI Dashboard to Run Every Week
- Price Variance %: How much is your price fluctuating week-over-week? (Goal: <5%)
- Deal Badge Eligibility: Are your “Was” prices sticking, or are they being suppressed?
- Rufus Sentiment: Test asking Rufus about your own product. What does it say?
Where Big Internet Ecommerce (BIE) Fits In
We don’t play pricing games. We build profit models.
- Unit Economics Lab: We calculate your “True Floor” and “True Ceiling” prices to build a sustainable model that doesn’t rely on fake discounts.
- Promo Calendar Architecture: We map your deals 90 days out, ensuring your price history looks clean, stable, and trustworthy to both humans and AI.
- Value-Based Listing Optimization: We ensure your content sells the product, not just the percentage off.
Get your “Pricing Stability Audit” today.
Book a 20-min session with Big Internet Ecommerce today!
Follow Big Internet Ecommerce (BIE) on Instagram & LinkedIn to stay updated with the latest trends in Amazon selling.


